Visualizing Garmin Data and Building a Personal AI Training Assistant

Last year, I bought a Garmin smartwatch to keep track of my bike rides. I like being able to see data from my rides and compare it with my perceived effort. I also like to classify different routes to see which ones are "worth" it in terms of effort, time, and scenery. I ended up subscribing to Strava for even more stats.
This summer, I got back into biking. Garmin Connect still provides useful summaries, but it does not give me the route-level exploration and cross-activity comparisons I wanted. I don't really want to subscribe to Strava, even if only for a few months during the summer. Free plans don't offer much useful data these days, and even if you pay, I couldn't drill down into the data as much as I'd like. What a bummer.
So, I started investigating to see what could be done. I'm mostly interested in my GPS track, heart rate, and the ability to classify routes based on their "training effect". Note that I'm a beginner here and mostly don't know what I'm doing. I like the stats from Garmin and Strava, but I can't zoom in on specific sections of a route using a map synchronized with elapsed time and GPS data.
Around the same time that I started using a smartwatch, I also got into homelabbing. I figured I could combine the two. As a software engineer, I use tools like Grafana and Kibana daily to visualize dense data, such as time-series data.
I searched online and found a library that does exactly what I was looking for: https://github.com/arpanghosh8453/garmin-grafana. It fetches Garmin health data from Garmin's API, populates a local InfluxDB database, and connects Grafana to it to visualize the data. It also provides a default dashboard.
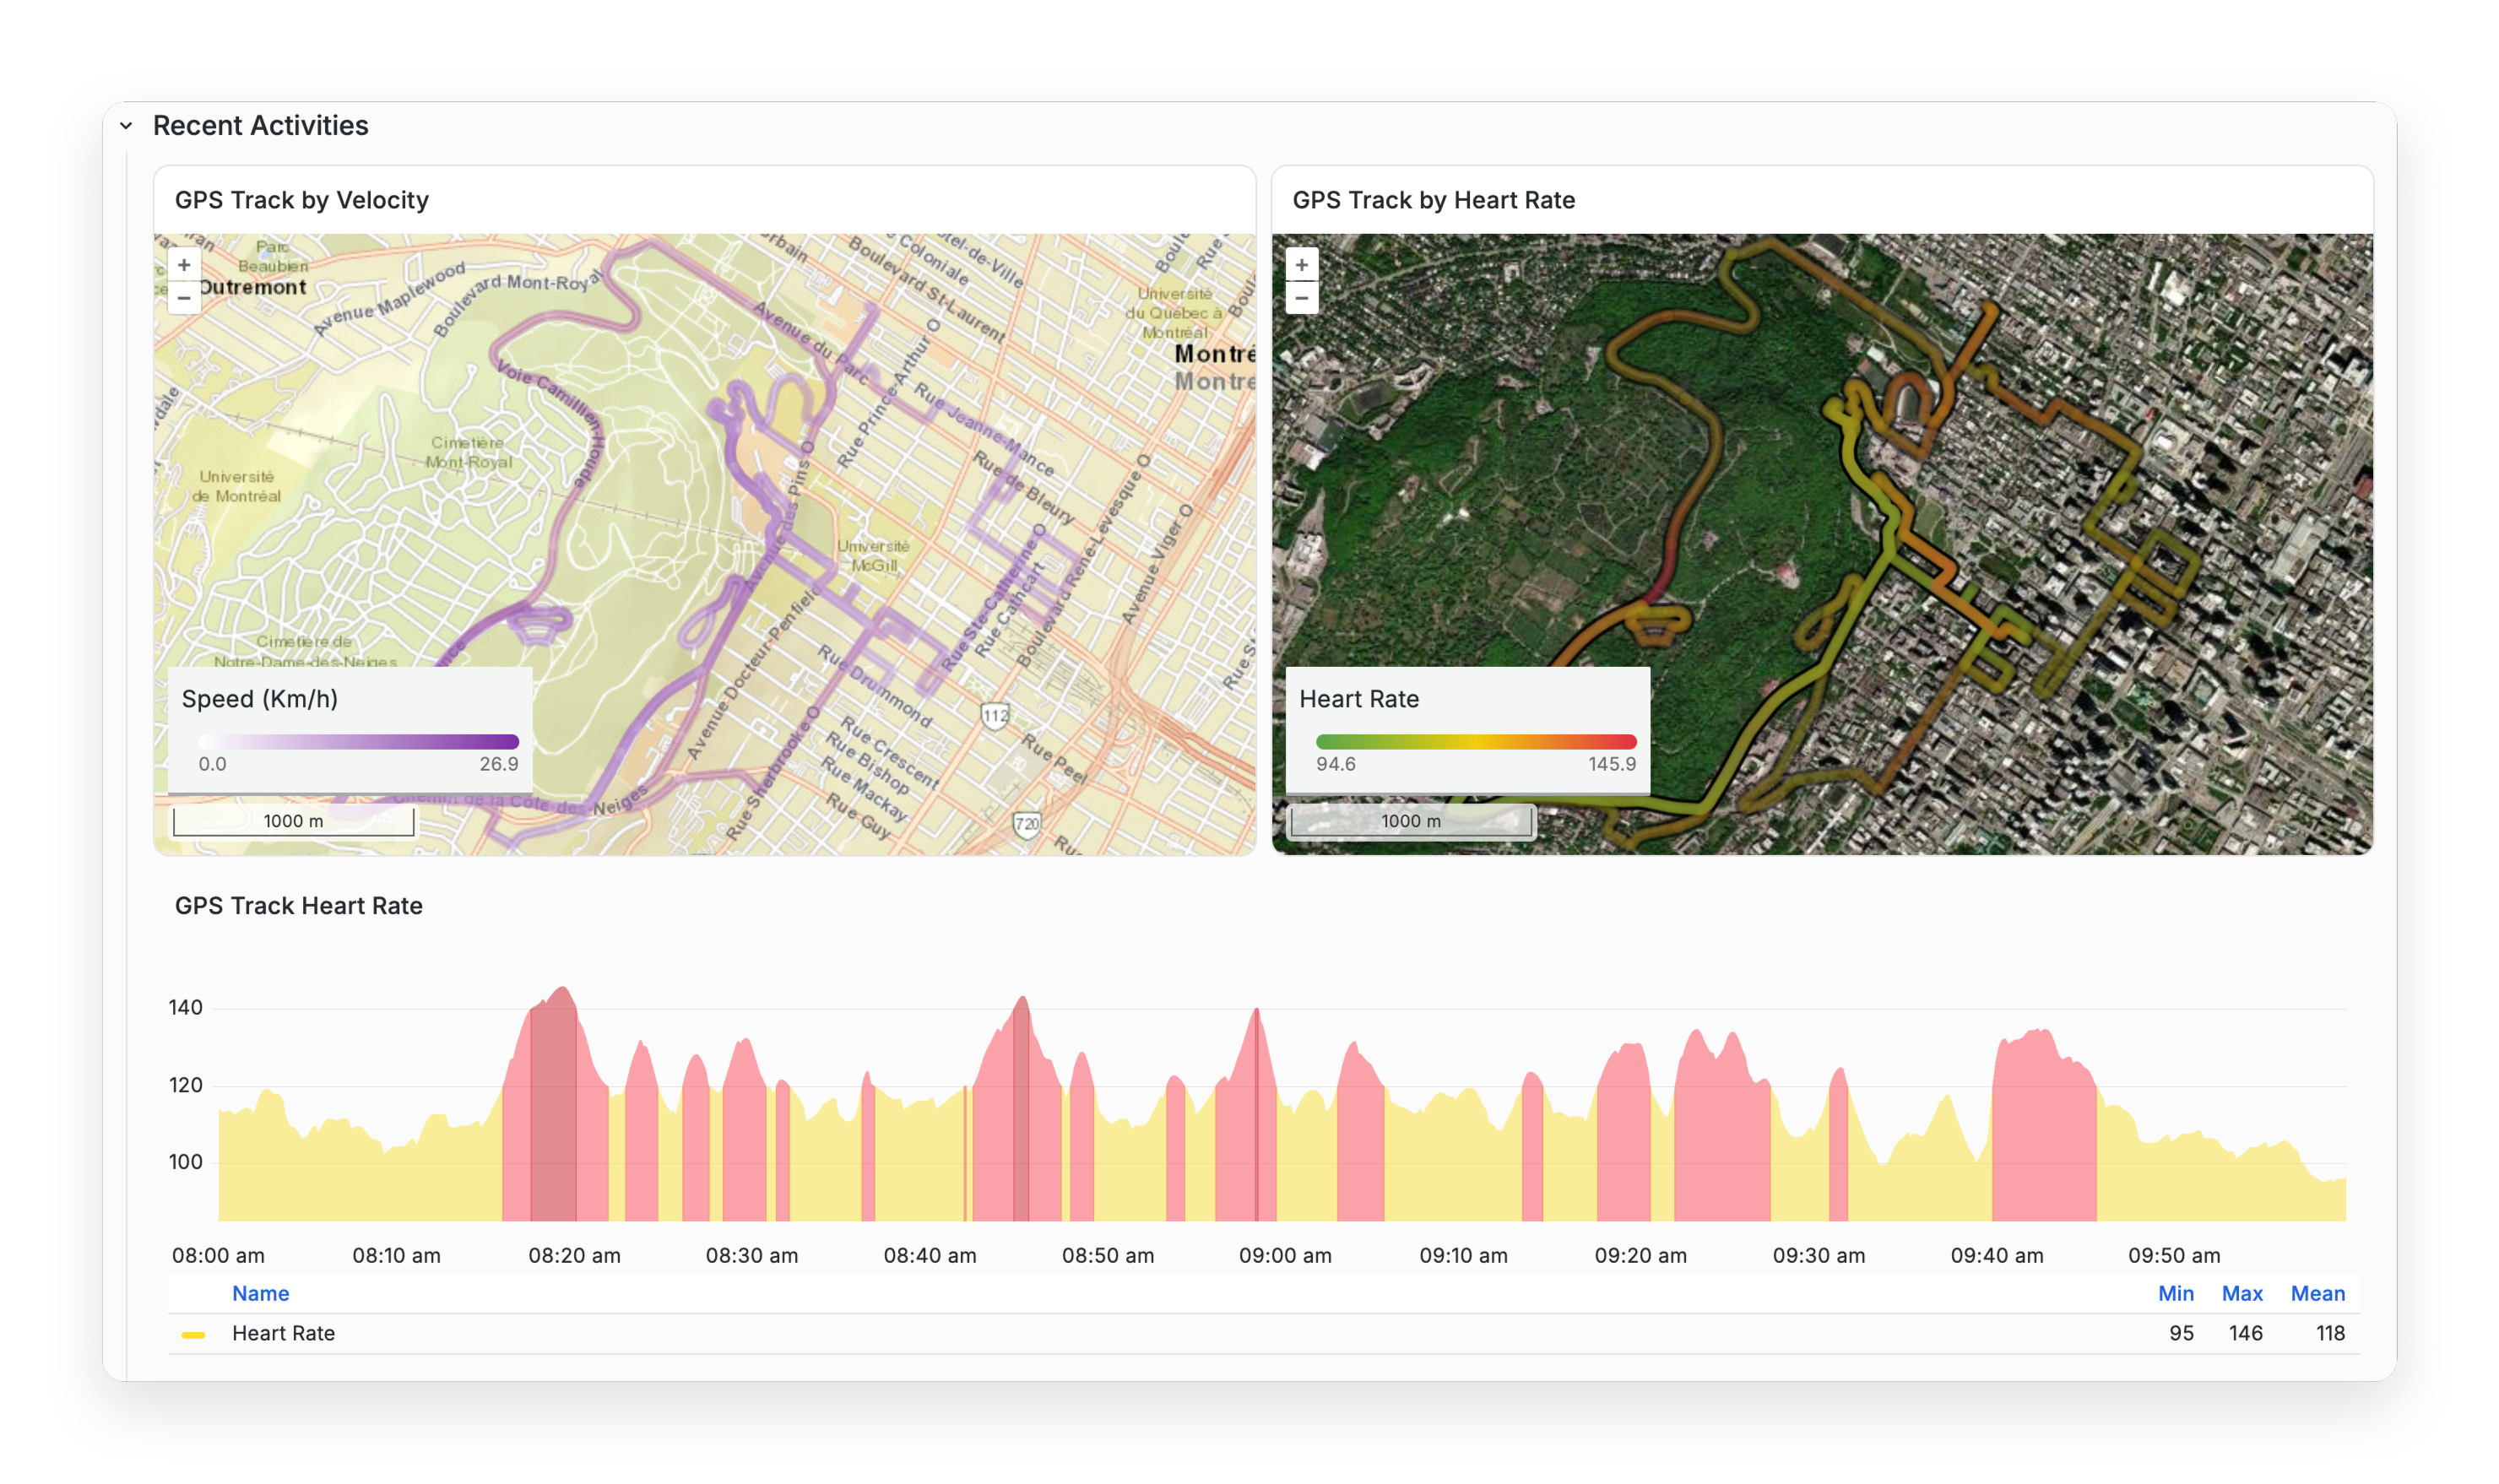
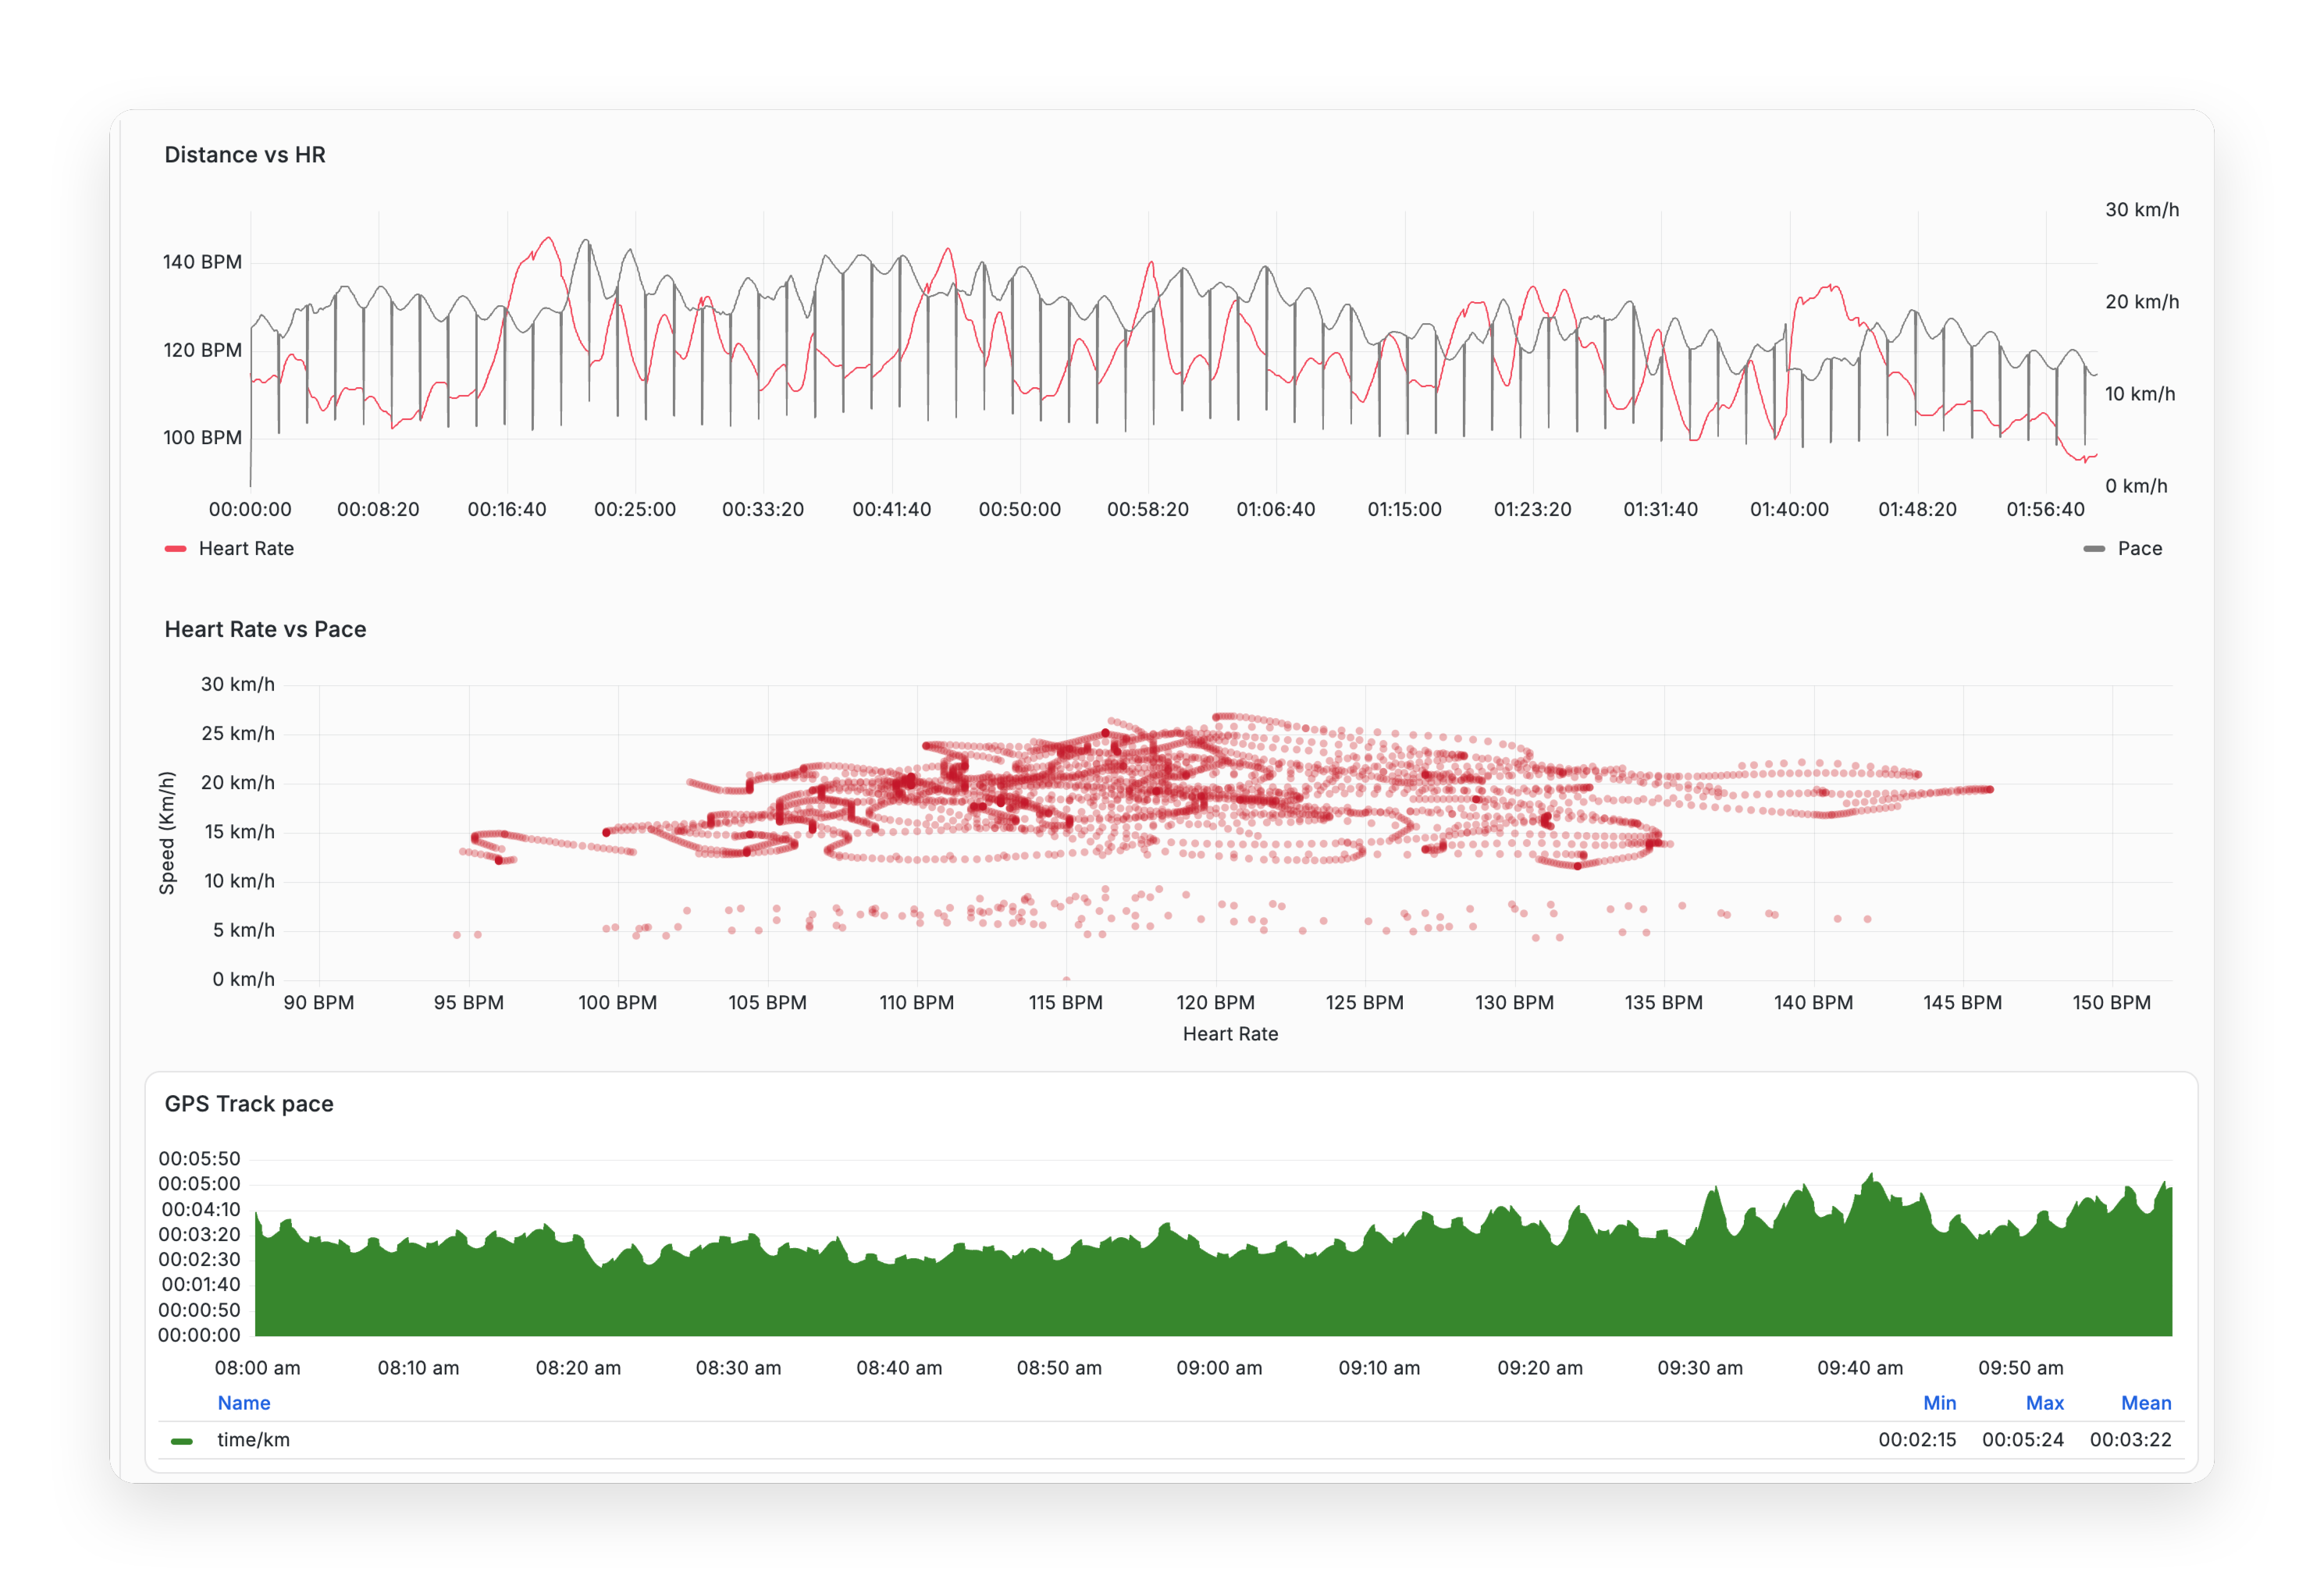
This is exactly what I was looking for. As you can see, the default dashboard is already great out of the box and lets you quickly visualize your latest activity or pick another one.
But it wasn't enough for me. The data is easier to read this way, but why not leverage this Grafana setup through the Grafana MCP and connect it to an AI agent? That way, instead of manually reading every graph, I can use an AI training assistant to analyze and compare my activities without paying for another fitness subscription, aside from the tokens used by the model.
How the AI Training Assistant Works
The Model Context Protocol (MCP) acts as the bridge between the AI agent and Grafana. It gives the agent tools to inspect my dashboards and query the InfluxDB data source behind them. The model does not need a screenshot of a graph or a manually exported CSV file: it can request the relevant data for a specific activity or time range directly from Grafana.
This means I can ask questions in plain language, such as:
- How did my heart rate and pace change throughout this ride?
- Where did I spend the most effort, and how long did I sustain it?
- How does this ride compare with the last time I completed the same route?
- Which routes provide the best training effect for the time they take?
The agent translates the question into queries, retrieves the relevant measurements, and summarizes the result. It can combine metrics that would otherwise require me to move between multiple panels, and it can repeat the same analysis across several activities without me manually aligning their timelines.
The biggest benefit is not that AI replaces the dashboards. Grafana remains the best way to inspect the raw data and verify what happened. The agent adds a conversational layer on top of it: it helps me find patterns, compare repeated rides, and decide where to look more closely. It is less of an autonomous coach and more of a training assistant that can navigate my data much faster than I can.